

Step 1: Confirm ECG Setup
- Patient name, date, time of recording
- Paper speed: 25 mm/s
- Calibration: 10 mm/mV
- Check lead placement and rule out artifacts

Step 2: Determine Heart Rate
- Normal: 50–100 bpm
- Regular rhythm:
- Use the 300 rule: 300 / number of large squares between two R waves
- Irregular rhythm:
- Count the number of R waves in a 10-second strip and multiply by 6
- Escape rhythms:
- Atrial: 60–80 bpm
- Junctional: 40–60 bpm
- Ventricular: 20–40 bpm
Step 3: Assess Rhythm
- Regular vs. irregular vs. irregularly irregular
- Identify the P wave before every QRS and the QRS after every P
- Sinus rhythm: P upright in leads I, II, and aVF + rate 50–100 bpm
- Irregularly irregular = think AFib
Step 4: Evaluate Axis
- Look at leads I and aVF:
- Lead I +, aVF + → Normal axis
- Lead I +, aVF − → Left axis deviation (LAD)
- Lead I −, aVF + → Right axis deviation (RAD)
- Lead I −, aVF − → Extreme axis
- Normal axis: −30° to +90°
Step 5: Measure Intervals
- PR interval: 120–200 ms (3–5 small squares)
- QRS duration: ≤120 ms
- QT interval:
- Use Bazett’s formula for QTc
- Normal: <440 ms (men), <460 ms (women)
Step 6: Assess P Wave Morphology
- Left atrial enlargement (LAE):
- Bifid P wave in lead II
- Biphasic P in V1 (terminal negative portion >1 mm)
- Right atrial enlargement (RAE):
- Tall, peaked P waves in II and V1 (>2.5 mm)
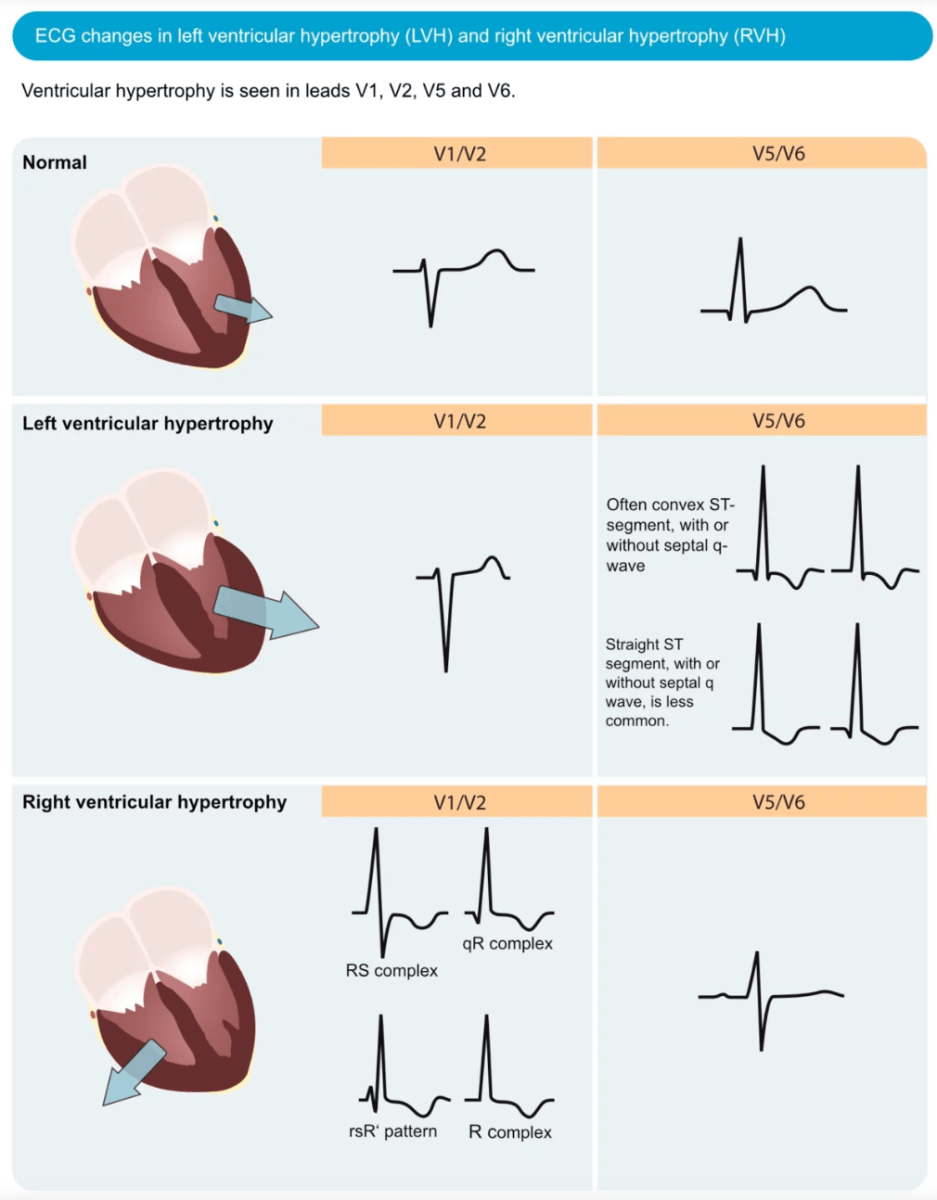
Step 7: Examine QRS Morphology
- Bundle Branch Blocks (BBB):
- LBBB: Broad, notched R in V5/V6; deep S in V1
- RBBB: rsR’ in V1; wide S in V6
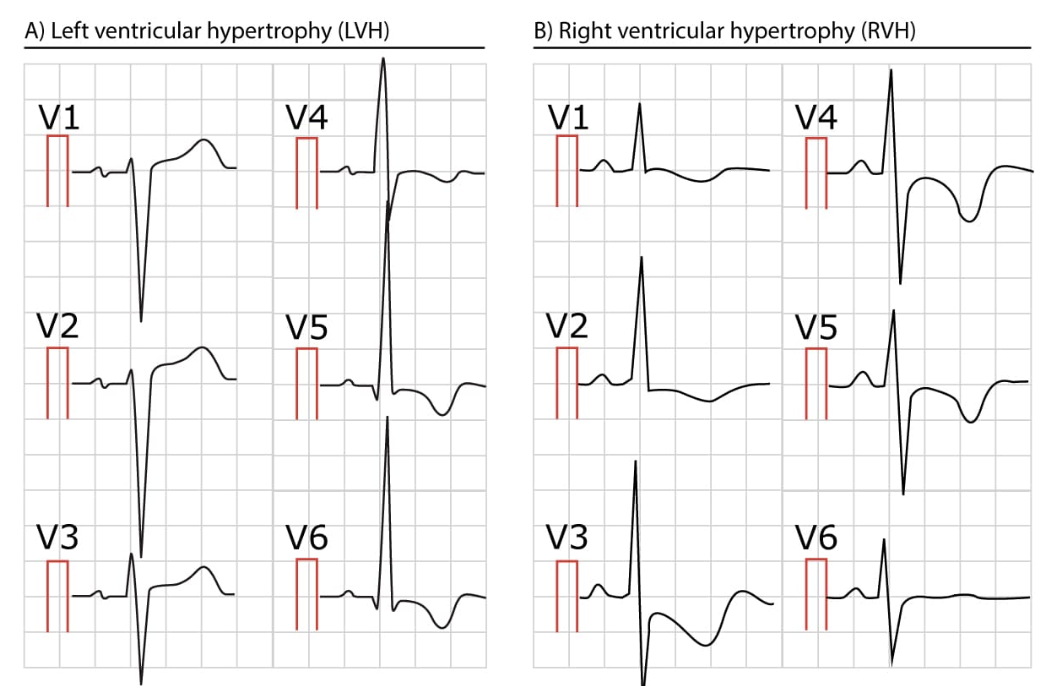
- LVH criteria:
- S in V1 + R in V5 or V6 >35 mm
- RVH criteria:
- RAD + R/S >1 in V1

Step 8: Review ST Segment and T Waves
- Ischemia: ST depression, T wave inversion (V1–V6)
- Infarction: ST elevation in the affected area
- Reciprocal changes in opposite leads
- T wave changes: hyperacute (early), inverted (later)


*all images are from ecgwaves.com
Step 9: Look for Pathologic Q Waves
- 1 small square wide
- 25% of R wave height
- Present in ≥2 contiguous leads
Step 10: Check for Miscellaneous Patterns
- Electrolytes:
- HyperK: tall T waves → sine wave
- HypoK: U waves, ST depression, long QT
- HypoCa: long QT; HyperCa: short QT
- Drugs: digoxin (scooped ST), antipsychotics (QT prolongation)
- Others:
- Osborne J waves (hypothermia)
- Diffuse ST elevation + PR depression (pericarditis)
🚀 Final Step: Clinical Correlation
- Summarize: rate, rhythm, axis, intervals, major abnormalities
- Always compare to previous ECGs
- Always correlate with symptoms and clinical scenario
- For related cases, explore our approach to palpitations and chest pain to connect ECG findings with real clinical decisions.
📚 References & Further Reading
- Life in the Fast Lane – ECG Library
Huge, easy-to-navigate library with annotated ECG examples and clinical pearls
🔗 https://litfl.com/ecg-library/ - ECG Waves – Clinical ECG Interpretation
Detailed step-by-step explanations, beautiful visuals, and case examples
🔗 https://ecgwaves.com/ - Geeky Medics – ECG Interpretation Guide
Concise and OSCE-friendly; great for beginners and quick refreshers
🔗 https://geekymedics.com/how-to-read-an-ecg/ - BMJ ECG Basics Article
Evidence-based clinical approach in a structured review
🔗 https://www.bmj.com/content/357/bmj.j1720 - American Heart Association (AHA) – ECG-Related Guidelines
Searchable hub for official ECG-related guidance (e.g., STEMI, blocks, arrhythmias)
🔗 https://www.ahajournals.org/
(Tip: search “ECG” or “STEMI criteria” in the site search bar)